Xcode 4 Instruments Awesomeness
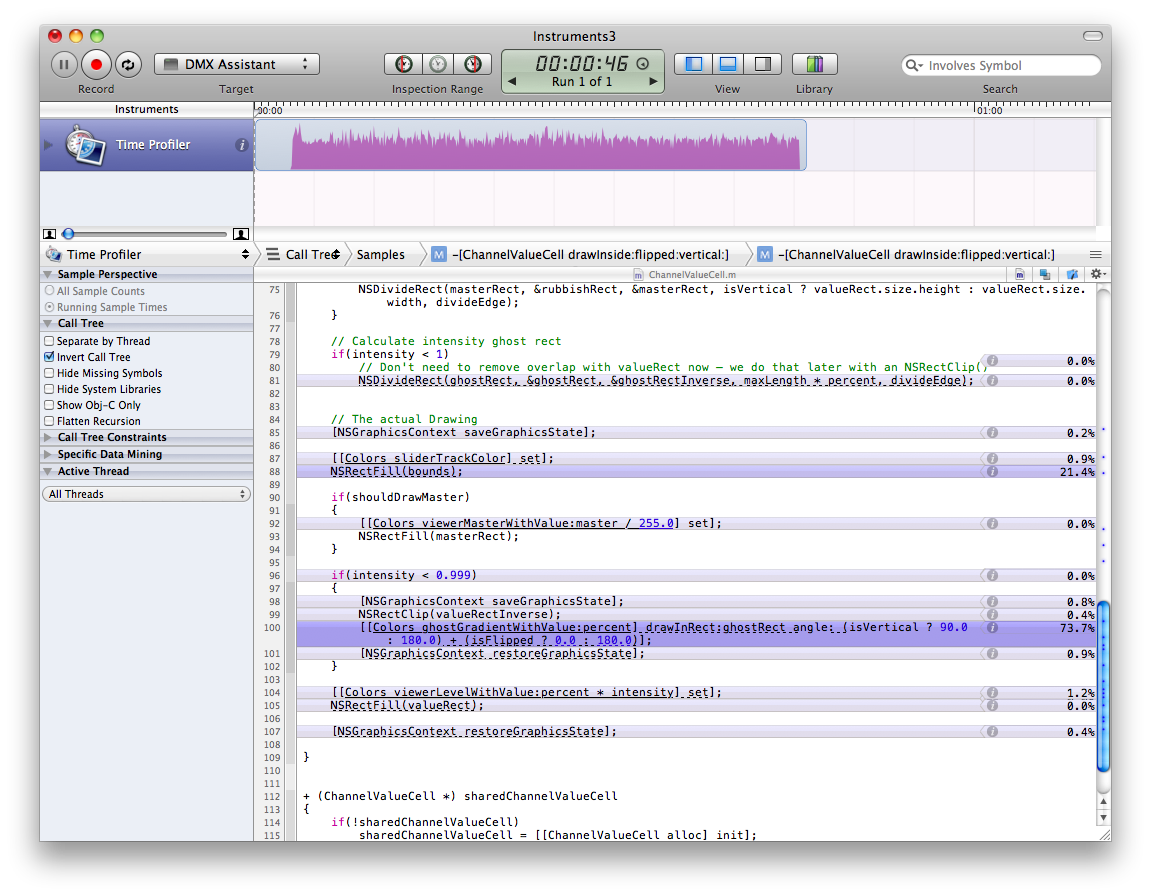
Very useful feature of Xcode 4* – in an Instruments time profile, just double click one of your methods and it’ll show you the code and which lines are the killers.
I’m not sure if this was around before Xcode 4 or not – I only just found it now.